Additional GitLab Metrics Using `Pg_exporter`

GitLab makes a great deal of information available through Prometheus metrics. But not everything.
Since writing this article, it has come to my attention that there are two
more generic “sql_exporter” options. This is less important with GitLab, as
you’re basically going to be running Pg, but these are the generic SQL
exporter we’re turning postgres_exporter into, below.
The other day I was looking for how many CI jobs and pipelines had been created, total. I figured that would be somewhere in the collection of existing metrics, but the closest I could find was a metric that gave the totals relative to the last time the exporter was restarted.
I use a couple GitLab-specific exporters in this environment already, and thought about creating another one to handle this. As it turns out, this information isn’t exposed through the API, either. It looked like the only way to get this information was to query the database directly.
--extend.query-path
While poking around, I noticed that postgres_exporter
has an interesting flag, --extend.query-path.
I did as suggested and checked out the queries.yml. Turns out it’s surprisingly easy to create new metrics out of database queries, e.g.:
|
|
The above causes two additional metrics to be generated by the exporter:
ci_builds_total and ci_pipelines_total. Neat. To get the information I
want, all I need to do is ask postgres_exporter nicely for it.
Configuring the exporter
The GitLab Omnibus package sets up a number of exporters, including
postgres_exporter with --extend.query-path already set. However, messing
around with a configuration file the omnibus package is responsible for did
not sound like fun, and neither did I want to cause the same Pg metrics to be
exported twice. Examining the exporter’s flags again, I see two that may
help.
disable-default-metricsUse only metrics supplied fromqueries.yamlvia--extend.query-path.disable-settings-metricsUse the flag if you don’t want to scrapepg_settings.
Looking at those two flags, it appears that I should be able to disable the “standard” metrics and only run the ones I provide in the query file.
Running the exporter
To me, it seems easiest to run our custom postgresql_exporter in parallel
with the GitLab supplied one. Running it in a container also allows us to
ensure it keeps running (--restart) and runs as the correct user/group for
access.
postgres_exporter is a widely-used and reliable tool,
if you break your server you get to keep both parts.A small scriptie to start the exporter, disable standard metrics, and run ours is below. Note that it also ensures it is run as the correct user/group for database access, and the Pg socket + configuration is bind-mounted inside the container for access.
|
|
With that, the metrics exporter is exposed and ready to be scraped at
localhost:19187/metrics.
|
|
Conclusion
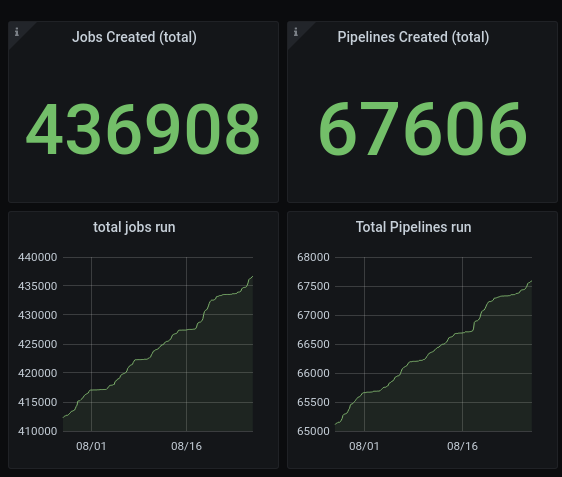
With this in place, we can collect and display or alert on these custom metrics. And, of course, everyone loves a good dashboard graph:

This might seem like a lot for two small metrics, but compared to writing a
custom exporter it’s nothing. If you’re like me, you’ll also discover your
queries.yml will quickly grow with additional metrics definitions.